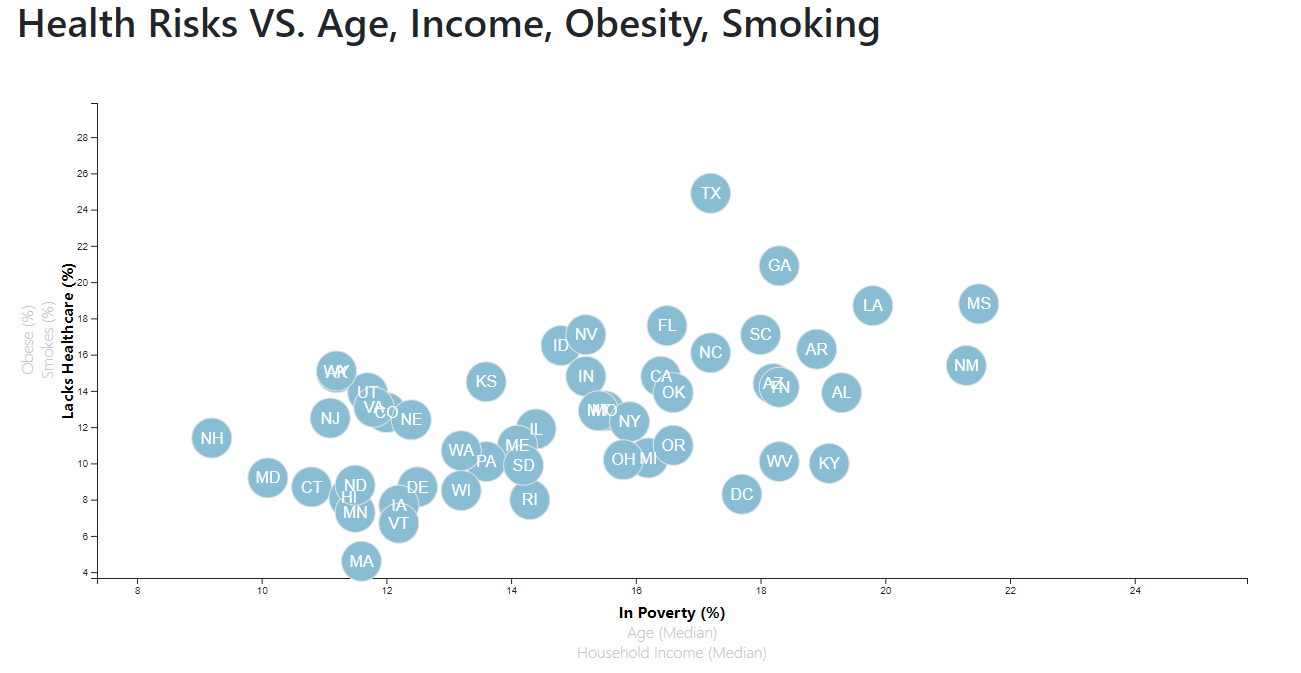
Data Journalism in Health
Project Details
- Category: Web Chart
- Project Date: 24 Nov, 2020
- Live Website: erikayi.github.io/D3-challenge
- Github Page: github.com/erikayi/d3-challenge
Using D3.js (one of the popular JavaScript libraries for creating tables in the website), design the table telling us about the differences between the health risks and income status.